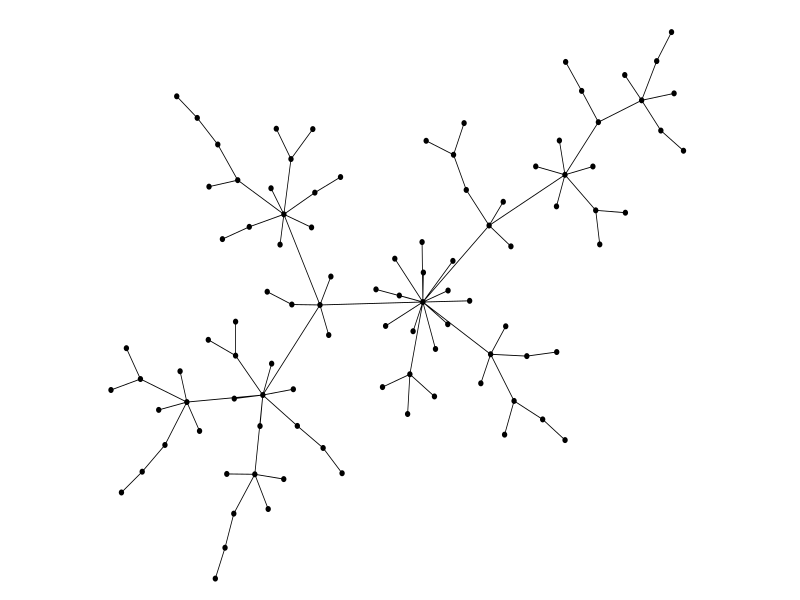
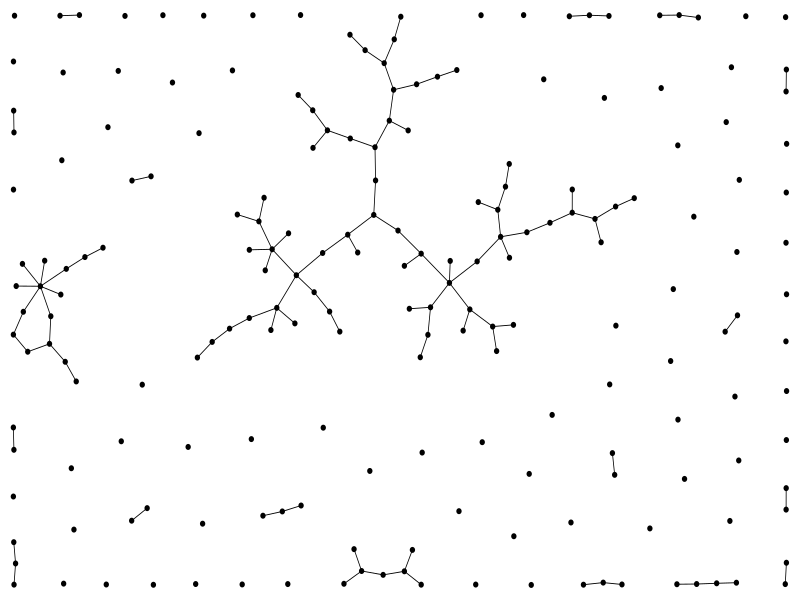
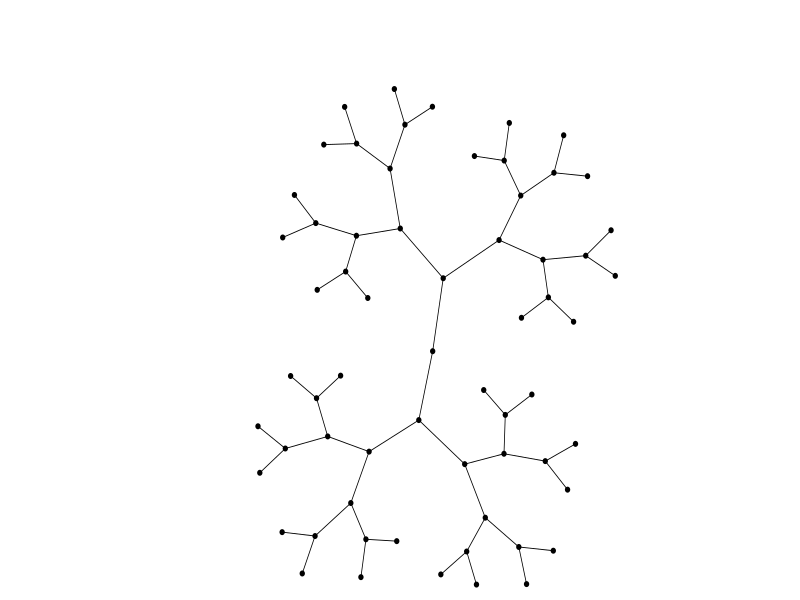
Uses simulated annealing to draw nice looking draphs (or at least attempt to). The algorithm is based on Drawing Graphs Nicely Using Simulated Annealing by Davidson and Harel.
Requires C++11 and cairo. The code is very experimental.
Some examples of drawn graphs can be found under the examples directory.
CMake and cairo are required.
mkdir b
cd b
cmake ..
make -j4- Upload some example images
- More graph constructions.
- Consider some randomly generated graphs.
- Interactive graphical user interface. Animate the SA process.
- Faster energy evaluation. Needs some acceleration structure.
- In most cases we don't have to check vertex against every other.
- Maybe it's possible to avoid having to check edge against every other.
- Alternatively, SIMD can offer near 4 fold speedup.
- Thread safe and faster random numbers.
- Structure the code better.
- Build system.
- Usage instructions on github.


