-
Notifications
You must be signed in to change notification settings - Fork 5
Project 1
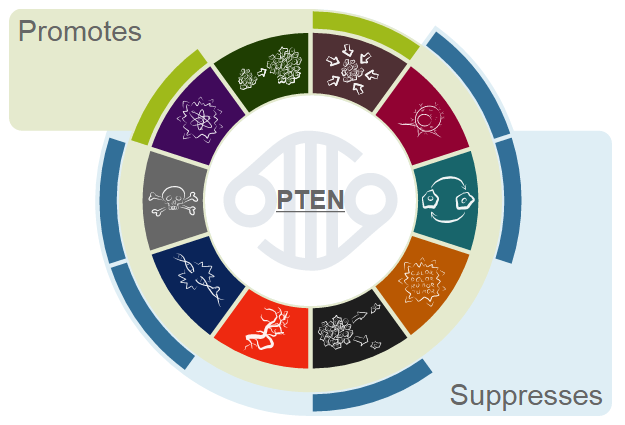
Normal cells transform into cancerous cells by acquiring biological capabilities summarized into 10 hallmarks of cancer (Hanahan and Weinberg 2000). Hallmarks of cancer are usually acquired through somatic genomic alterations in cancer genes (also known as "drivers" or "driver genes" as they initiate or "drive" cancer genesis), whereby a DNA alteration (SNV, indel, structural variant) appears in the tumor due to intrinsic errors in DNA copy during mitosis or due to extrinsic factors such as environmental exposures (smoking, UV light, etc). Although the influence of cancer genes on each hallmark of cancer is well documented, and although recent large-scale genomic studies have revealed the temporal acquisition of somatic alterations in such cancer genes, whether there is a necessary sequence of acquisition of cancer hallmarks is unknown.


One way to study the temporal acquisition of hallmarks is to separate them in "clonal" or "subclonal" stages. Clonal evolution is a process that drives tumor heterogeneity, and can help pinpoint certain events in time. In summary, normal cells can acquire "clonal" mutations which gives them a selective advantage and initiate a tumor. As they multiply, some of these clonal cells can acquire other mutations, known as "subclonal" mutations, which adds a new cell population in the tumor as the subclones multiply. See https://missionbio.com/resources/learning-center/clonal-evolution-in-cancer/ for more explanations and visual examples.
- stage_data : PCAWG data giving clonal or subclonal status/stage to driver genes
- hm_data : COSMIC+IntOGen data giving all the currently known drivers with the corresponding hallmarks affected when the drivers are mutated
Scripting in R, data exploration, statistics
- Download the data (see with supervisor)
- Combine the 2 datasets to have 1 dataframe with at least, for each driver, the corresponding : site, cohort, clonal/subclonal status and affected hallmarks (careful with duplicates)
- Become familiar with the data : plots, tables… for example : most/least common site/cohort/stage/hallmark ? Understand the data from a biological point of view as well
- Per site : Show the number of genes affecting each hallmark in both stages, and comment on the results
- Statistically : are any hallmarks significantly more or less often affected in one of the 2 stages in particular ?
- Discuss limitations/biases in the study
- Conceptual understanding of the subject (reading the hallmarks papers is essential)
- Learning to make nicer plots in R
[email protected] (Nicolas Alcala)