Adapted for The University of Alabama.

##Requirements
- Ruby >= 2.2
- Jekyll >= 3.0
##Setup Clone this repository to your local machine and run "script/server" on a command line. Then navigate to http://localhost:4000 in a browser. By default Jekyll will rebuild the site whenever files change.
##Components
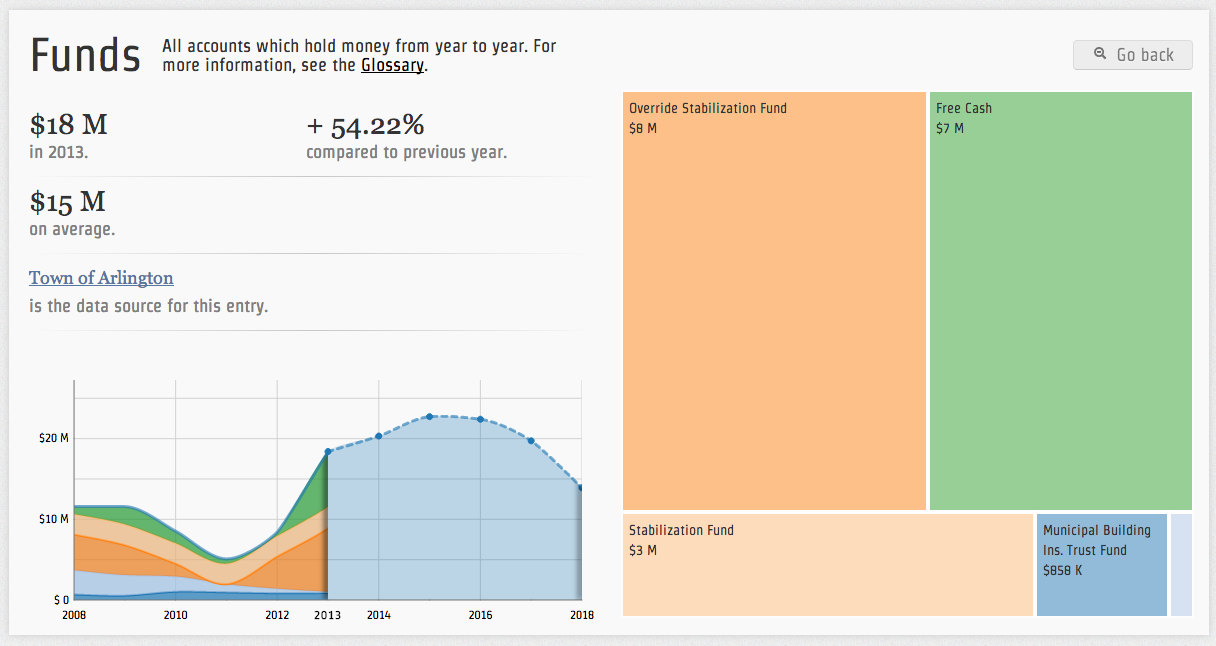
####Cards
Report statical information about selected entry (js/cards.js).
####Chart
Shows data change over time (js/chart.js).
####Treemap
Used as the main navigation component (js/treemap.js).
####Table
Alternative navigation technique to a treemap (js/tables.js).
####Component Interface Each component implements a common interface of 3 calls:
Initialize: called only once, prepares the component to show dataOpen: opens a data object and displays its contents using the specified componentUpdate: refreshes component data (useful when year changes and new values need to be plotted)
##Directory Structure
- _config.yml: Jekyll configuration file
- _data: CSV and JSON data files
- processing: temporary directory for data conversion
processCSV.py: converts CSV file to nested JSON structureupdate.php: Interface for data update
- css: compiled SCSS and libraries (bootstrap, introJs)
- img: image assets
- docs: documentation
- _layouts/default.html the HTML layout for the single page
- _includes: templates and HTML assets
imports.php: CSS and JS assets importsdatafiles.php: json datafiles loaded in each instance (AJAX can be used as an alternative)home.php: homescreen htmlnavbar.php: navigation bar htmltemplates.php: contains Mustache templates (eg. table row templates, cards...)
- js: Javascript assets
avb.js: helper functions and initialization routinescards.js: cards component routineschart.js: chart component routineshome.js: homescreen routines and introJs based tutorials codestatistics.js: functions used to generate statistical info and number formatting functionstable.js: table component routinestreemap.js: treemap component routines
- scss: SCSS files
print.scss: SCSS applied when printing a Visual Budget pageglobal.scss: main SCSS file (imports all the partials defined below)- partials: SCSS assets
_avb.scss: section styles_base.scss: html, body styles, colors and font variables_cards.scss: styles for card component_chart.scss: styles for chart component_home.scss: styles for homescreen_navbar.scss: styles for top navigation bar_table.scss: styles for tabular view_treemap.scss: styles for treemap component
####Required Libraries
- Bootstrap (grid layout, dropdowns..)
- D3 (visualizations)
- Jquery Cookie
- DetectMobileBrowser
- Jquery
- Mustache (templates)
- IntroJS (required for tutorials)
##Datasets Budget data is kept in JSON and CSV format. The JSON format is actively used for computation while the CSV format is kept for reference and data download.
####Data structure
The base data unit is an object with the following fields:
key{string}: entry namesrc{url string}: link to data source from where entry data was extracted (optional)hash{string}: entry id (can be arbitrary)sub{array of other entries}: subsections that make up current entrydescr{string} : entry description (optional)values{array of value objects} : entry values over time
A simple value object is defined by:
year: year of valueval: value
This data structure could be changed should it be considered not ideal for future uses.
####Data Processing Workflow
To get the data from open.ua.edu into the format needed for this application, one must follow these steps:
- Download the data from open.ua.edu one fiscal year at a time by entering date ranges, hitting Search, and exporting to CSV. Rename those files to
UA_FY_20XX.csvand put them in the_datafolder. - From the processing folder, run
combine_years.pyto combine all those files intoua_expenses.csv, which will be a very big file. Ensure that the process worked but please don't try to commit it or any other huge file to the repo. - Run
fix_commas.pyto quote the fields that contain commas and remove extra commas. This should generateua_expenses_fixed.csv. - Run
convert_data.pyto calculate totals for each category, payee, and fiscal year combination inua_expenses_formatted.csv. This file should be significantly smaller in size than the others. - Rename
ua_expenses_formatted_.csvtoexpenses.csvif it looks right. - Run
processCSV.py updatehometo update thehome.jsonfile. - Run
processCSV.py ../_data/expenses.csvto generate theexpenses.jsonfile that the application will use.
For more information about CSV data formats or update procedures check docs/data.
##Core Contributors
####Involution Studios (Design and Coding)
- Lead Developer: Ivan David DiLernia
- Creative Director: Juhan Sonin
- Lead Designer: Roger Zhu
####Town of Arlington (Data Collection and Testing)
- Mike Bouton
- Andrew Flanagan
- Alan Jones
- Annie LaCourt
##License
Visual Town Budget is licensed under the Apache-2.0 open source license. You can find more information on the Apache-2.0 license at http://www.apache.org/licenses/LICENSE-2.0


