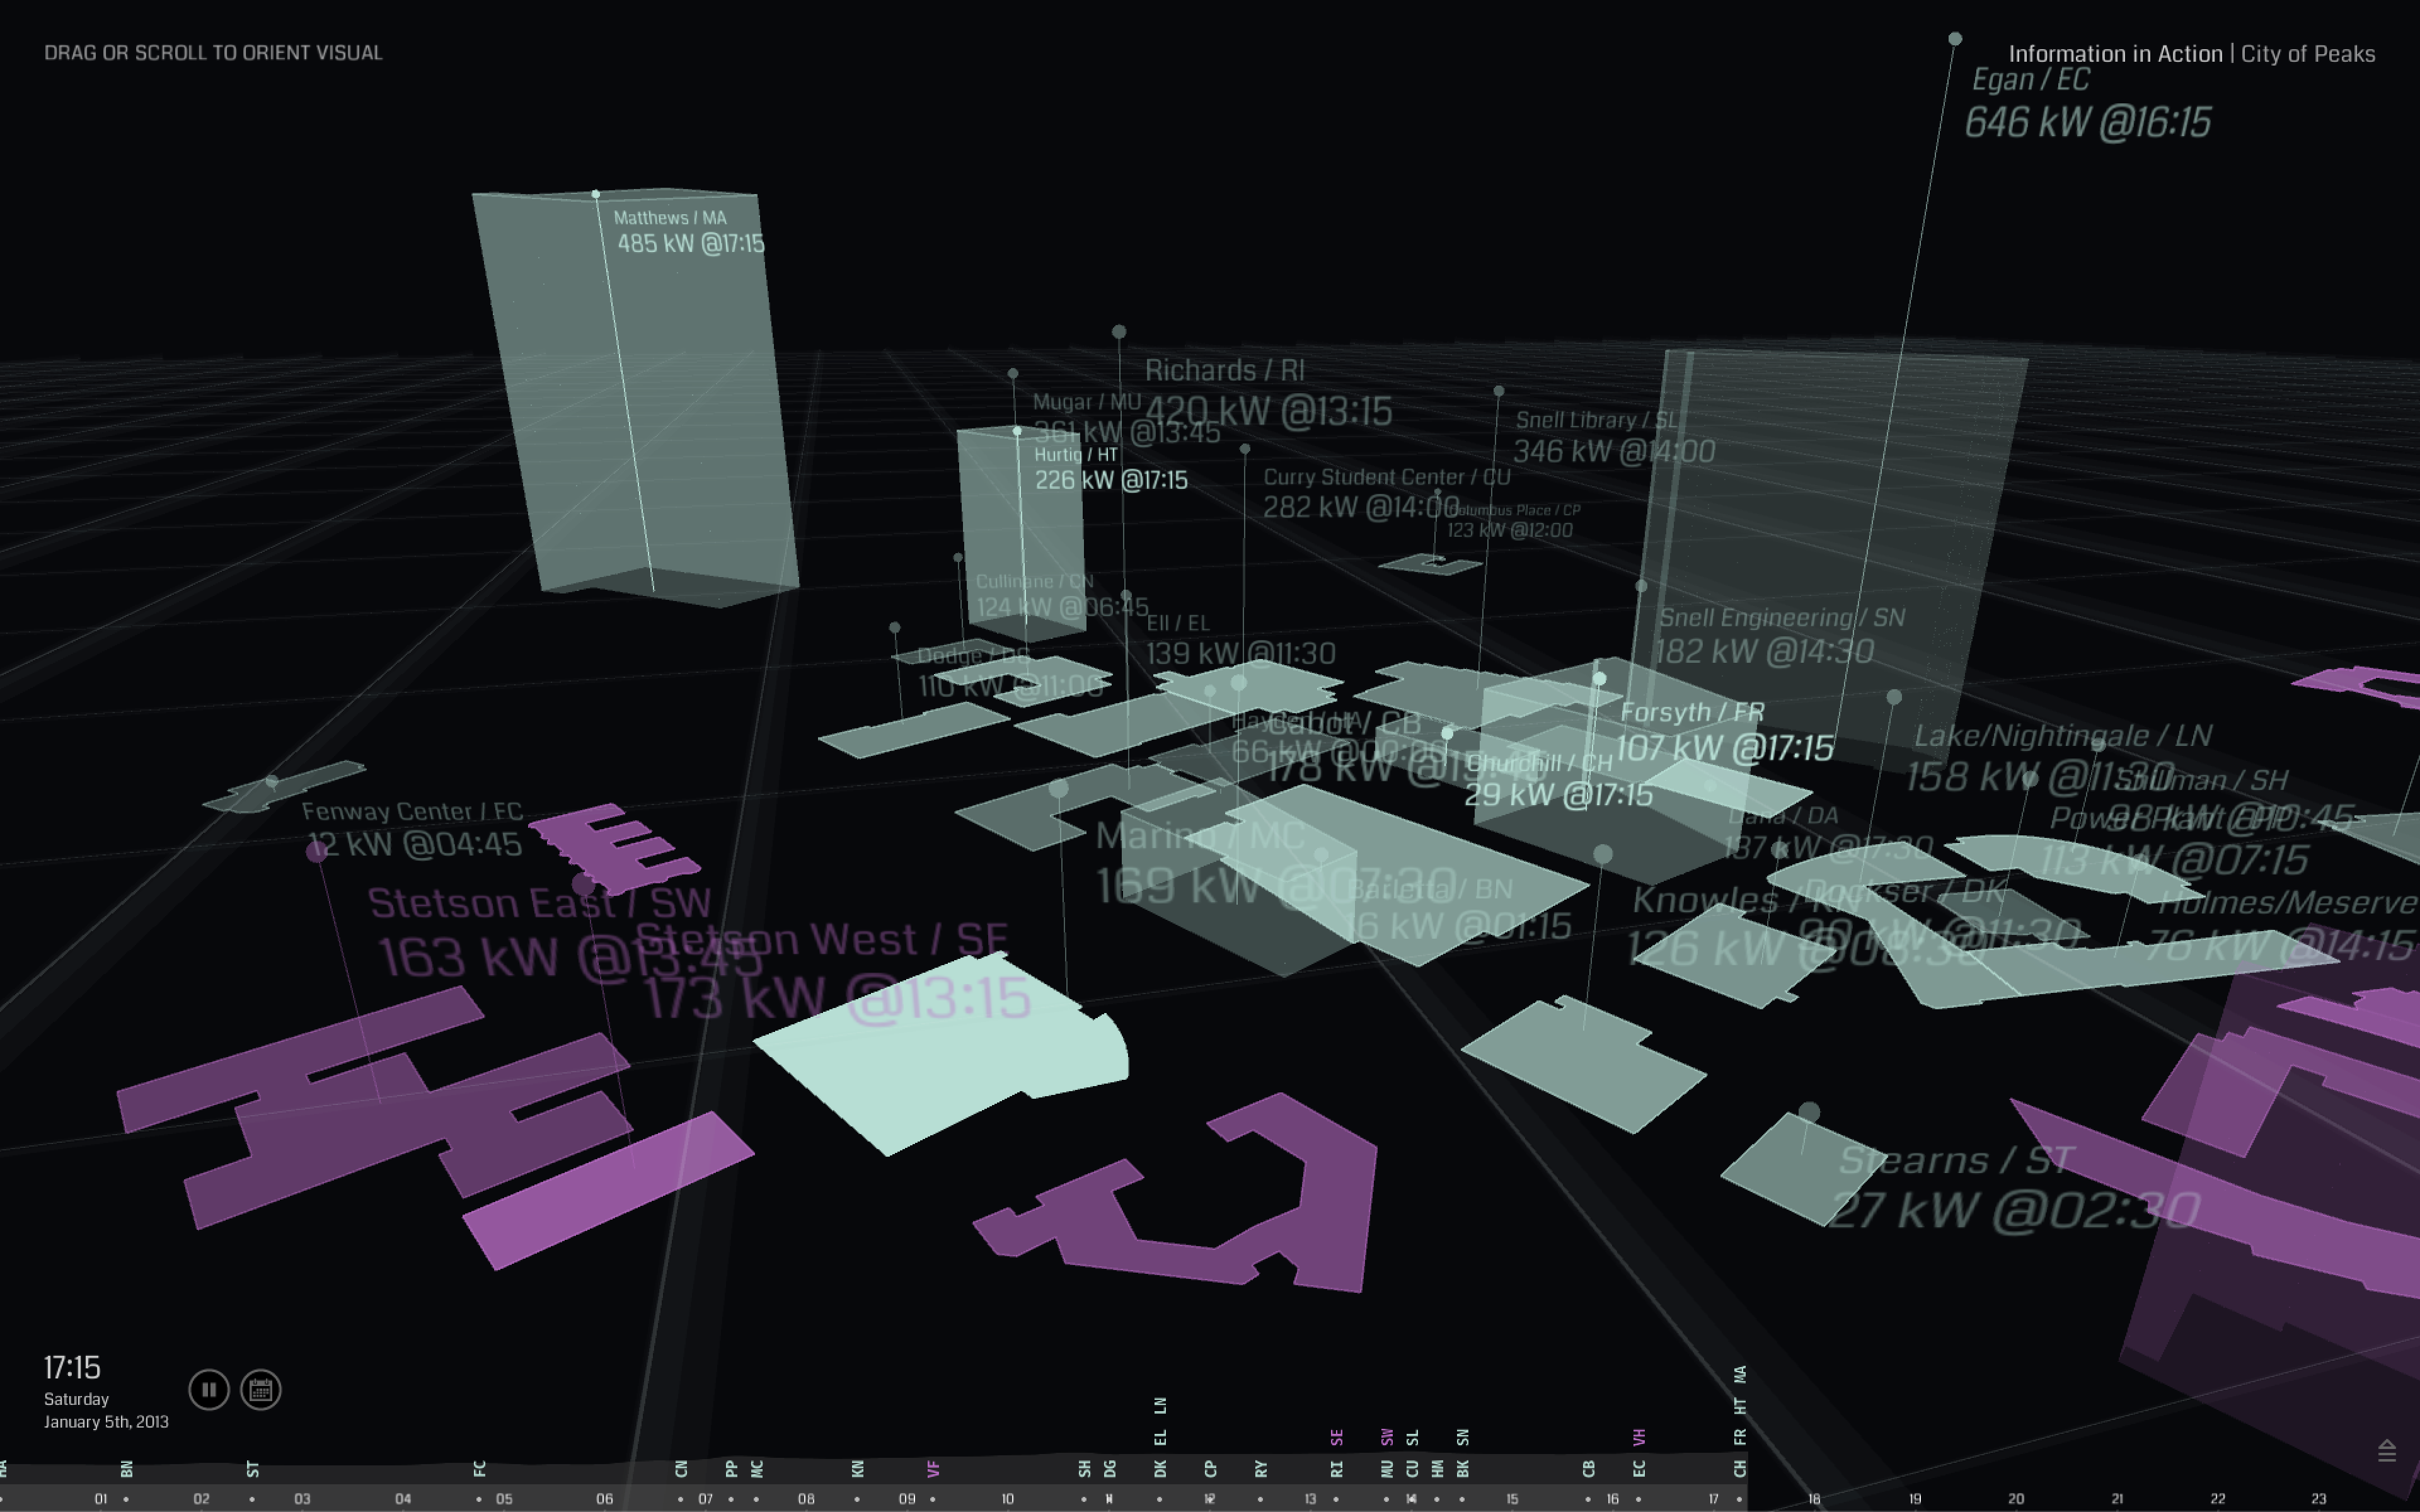
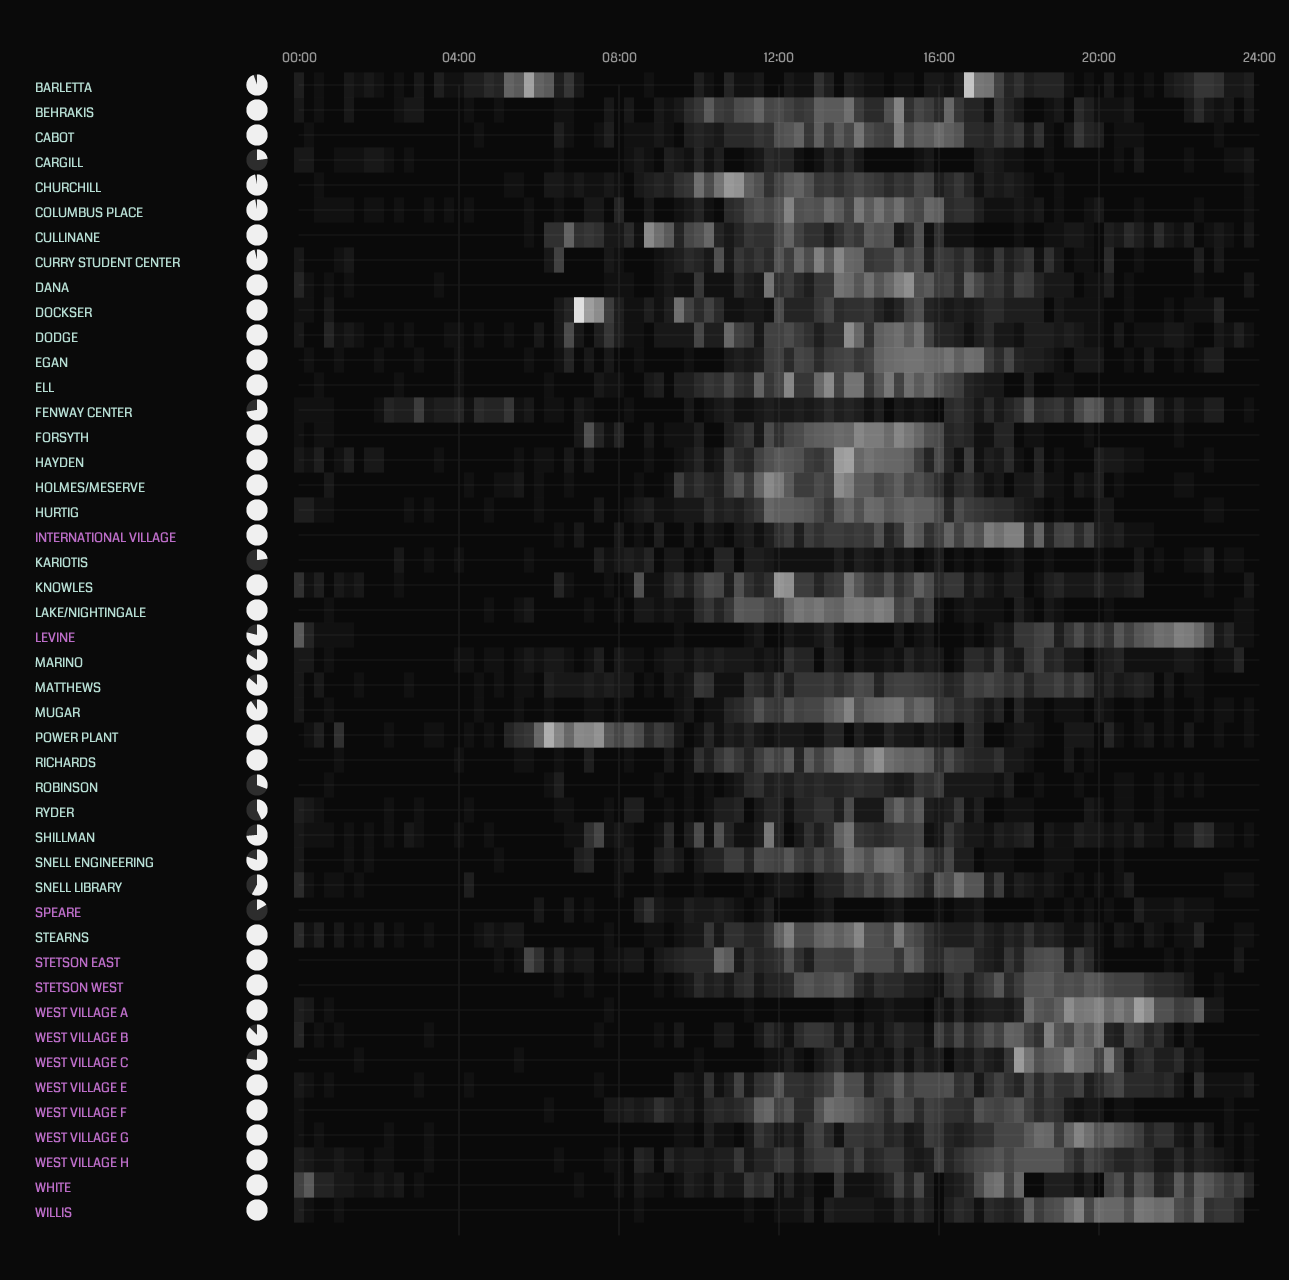
A data visualization project for Northeastern Energy Flows research group.
This is a 3D interactive data visualization that protrays energy usage of buildings in the Northeastern campus.
Featured exhibition at the university gallery, Gallery360, in 2016.
Gallery360 Exhibition Details: http://www.informationinaction.com/exhibition-northeastern-energy-flows-at-gallery-360/
Northeastern University Press: http://www.northeastern.edu/news/2016/08/energy-flow/
Northeastern University CAMD: http://www.northeastern.edu/art/northeastern-energy-flow/
Principal Investigator: Kristian Kloeckl
Research Assistants: Jeffrey Weng, Jennifer Heintz
Additional support during phase one: Mavez Dabas, Peyton Tiroff, Yuecan Fan, Corey Hoard
With technical support from Northeastern University Energy Group at the Facilities Division, Office of the University Registrar, Marketing and Communications.
Special thanks to Joe Ranahan.
This project is part of the Tier 1 Grant initiative “Institutional Data and Energy Flows”
PIs: Kristian Kloeckl, Guevara Noubir, Matthias Ruth


